

Future Services Review
Right-sized services, right-sized Council
Over July/August we asked people what services matter most, and where changes could be made, to help keep rates more affordable.
Your feedback has helped us to develop a number of proposals to reduce service costs and the amount funded through rates.
These proposals include more critical details than provided earlier - including implications and the potential savings that could be made.
This information may change how you think about each issue so we encourage you to take a minute to read the supporting information before giving your feedback.
Proposed service changes to reduce rates
- Feedback links for each proposal are included at the end of each drop-down menu below.
- If you would prefer to provide a written response hardcopy Feedback Forms can be picked up from your local Council office.
Why choices and trade-offs on services are needed
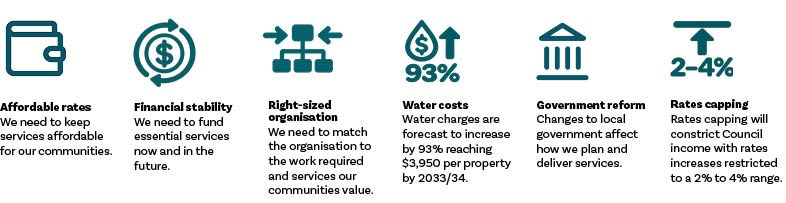
Council faces rising costs, reduced Government funding for major projects, proposed rates capping and major local government reforms.
Councils are increasingly expected to fund the operation, maintenance and renewal of their assets from their own revenue, with Government encouraging greater use of fees and charges so service users pay more of the cost.
With rates already unaffordable for many in Ruapehu, we must balance keeping rates affordable with retaining the services people value.
Rates capping and water charges
The Government has introduced legislation to cap council rates increases. Under the proposed system, councils would generally be expected to keep annual rates increases within a target range of 2% to 4% per year, although exemptions may be available in limited circumstances.
However, the proposed cap will not apply to your future water service charges.
This distinction is important because part of what you currently pay through your rates helps fund drinking water, wastewater and stormwater services. These services are scheduled to transfer to the new two-council Water Services Council-Controlled Organisation (WS-CCO) being set-up with Whanganui District Council. The new WS-CCO will set water charges separately and will be outside the proposed rates cap.
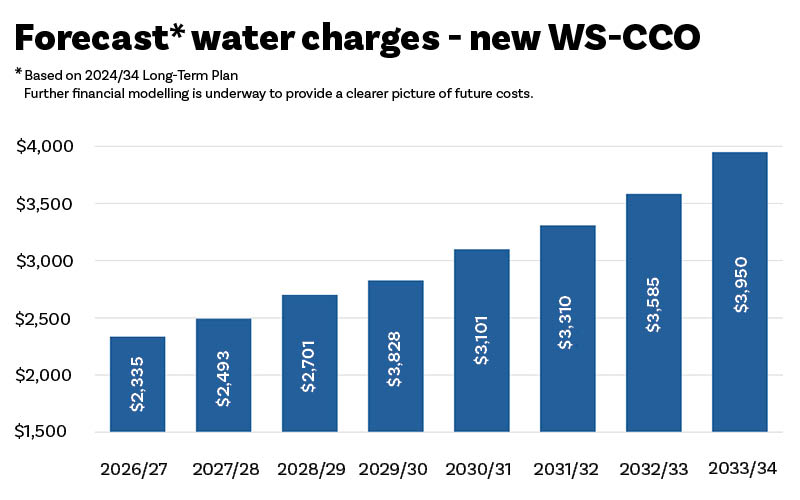
Current forecasts (based on the 2024/34 Long-Term Plan costs) indicate water charges will increase by around 92% between 2024 and 2034, reaching approximately $3,950 per property* by 2033/34.
What Does This Mean for You?
Council’s efforts to reduce costs and keep rates increases low will not impact on future water charges with future water costs set by the new WS-CCO.
Note:
- Managing affordability is a key focus as the new WS-CCO is established.
- In its response to the Water Services Delivery Plan, the Department of Internal Affairs also highlighted future pricing and affordability as important considerations as the new organisation is established.
- Further financial modelling is underway to provide a clearer picture of future costs.
Dog Fees - Proposal to increase fees
What we are proposing
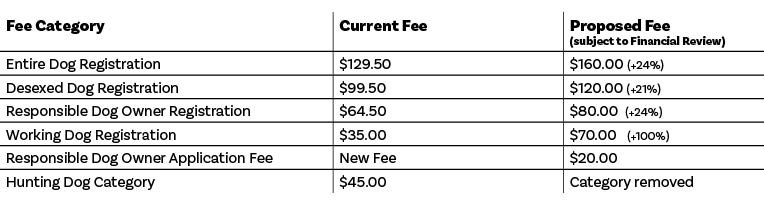
Council is considering increasing dog registration fees so that dog owners pay a greater share of the cost of dog control services.
- The table below shows the type of changes currently being considered.
- These figures are indicative only and may change as Council completes its financial review.
Note: To tell us what you think about this proposal click the banner at the bottom of this drop down.
What we currently deliver
Council provides dog control services to help keep people, pets and communities safe. These services include:
- Registering dogs
- Responding to complaints about dogs
- Investigating dog attacks
- Managing dangerous and menacing dogs
- Operating the dog pound
- Educating people about responsible dog ownership
- Maintaining the National Dog Database
These services help owners look after their dogs while helping keep public places safe.
Who should pay for dog control?
Council is required by law to provide dog control services to help keep people, pets and livestock safe. Its approach focuses on helping dog owners understand and follow the rules, preventing problems and responding when issues arise.
Council believes dog owners should cover most of the cost through registration fees. A smaller contribution comes from rates because everyone benefits from safer parks, streets and public places.
Currently, dog fees cover less of the total cost than the policy intends. Government is also encouraging councils to make greater use of fees and charges. Increasing the share paid by dog owners would reduce the amount funded through rates and place more of the cost on those who benefit most.
Please note that Council is intending to consult separately on the general principles of increasing fees and charges to lower rates at a later date.
How does our level of service stack up?
Ruapehu’s dog registration fees are generally lower than many neighbouring and comparable councils.
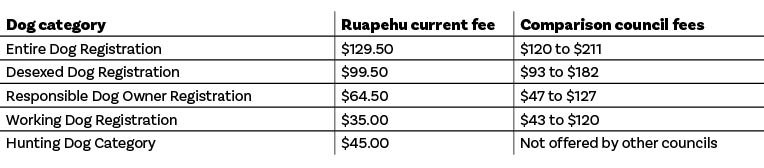
Even with the increases being considered, fees for responsible dog owners and working dogs would still be lower than many of our neighbouring councils.
What you could save
If dog owners pay more of the cost of animal control, less of the cost needs to be paid through rates.
The biggest changes being considered could generate around $125,000 per year in additional revenue for animal control services. This would reduce the amount that needs to be funded by all ratepayers by the same amount.
The trade-off is simple:
- Higher dog fees = dog owners pay more, rates pay less.
- Lower dog fees = more of the cost is shared by all ratepayers, including people who do not own a dog.
The question for the community is whether dog owners should pay a larger share of the cost of dog control services.
Have your say

Pride of Place Grant Fund - Proposal to remove contestable funds
What we are proposing
Council is proposing to remove the contestable part of the Pride of Place grant fund, which is worth about $44,000 each year at the moment.
Some community projects may still be able to get funding from charities, trusts or other organisations. However, some groups may find it harder to get funding if they no longer have a Council grant to help get their project started.
Note: To tell us what you think about the proposal click the banner at the bottom of this drop down
What we currently deliver
The Pride of Place Fund is a community grant fund. It helps local groups pay for projects that make Ruapehu a better place to live.
Council currently budgets $110,000 each year for the fund. Of this, $66,000 is already committed to specific organisations and community activities, leaving $44,000 available each year for community groups to apply for through a contestable grant process.
Groups and Marae can apply for funding to improve community spaces, facilities and neighbourhood projects.
The Pride of Place Fund is not the only grant available to local groups. Council would continue to administer programmes such as Creative Communities and Sport New Zealand Rural Travel Fund grants, and community groups would still be able to apply for funding from organisations such as Lottery Grants, Trust Waikato and other charitable trusts.
How does our level of service stack up?
Many councils provide grants to help community groups improve their towns and neighbourhoods.
Ruapehu’s Pride of Place Fund is Council’s main grant programme for community-led projects.
What you told us
In the July/August survey we asked the community about the funding that is set aside for specific organisations, including halls and pools (there are separate proposal questions on Taumarunui/Manunui halls and pools in this consultation).
This proposal only looks at the contestable part of the Pride of Place Grant Fund.
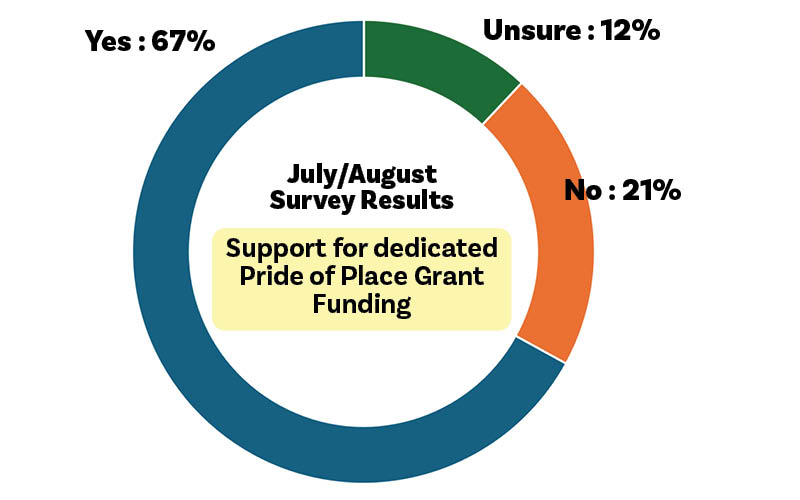
What you could save
Removing the contestable community grant fund would save approximately $440,000 over the next 10 years.
The choice is whether Council should continue providing community grants for local projects or use that money to help keep rates lower.
Have your say
Kerbside food waste collection - Proposal to stop service
What we are proposing
Council is proposing to discontinue the kerbside food scraps collection service during the next ten-year 2027/37 Long-Term Plan.
Note:
- There is an existing contract to deliver these services through till 2030.
- Residents would continue to receive kerbside rubbish and recycling collections.
Council is also interested in understanding whether support should be provided for alternatives such as home composting and worm farming.
Note: To tell us what you think about the proposal click the banner at the bottom of this drop down.
What we currently deliver
Council currently provides a weekly kerbside food scraps collection service alongside kerbside rubbish and recycling collections.
The service was introduced in October 2020 to help reduce the amount of organic waste sent to landfill and support waste minimisation across the district as part of its Zero Waste 2040 vision.
Lower-than-expected uptake has prompted Council to consider withdrawing the service.
How does our level of service stack up?
Providing a dedicated food scraps collection service is a higher level of service than many comparable rural districts. Among the 29 “small provincial and rural” councils, only six (including Ruapehu) provide food scraps kerbside collection.
Home composting and worm farming remain widely used alternatives for managing household food waste.
What you told us
In the July/August survey we asked whether Council should stop the kerbside food scraps collection service.
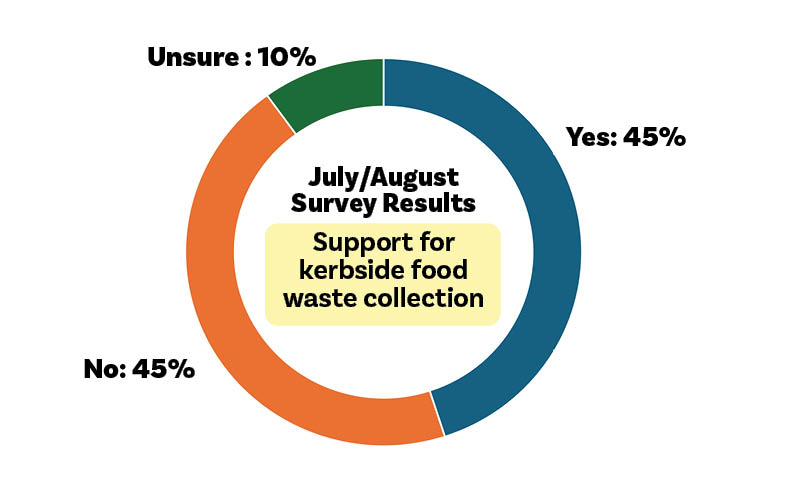
What you could save
Removing the kerbside food scraps collection service is estimated to save around $1.5 million over the next 10 years, after allowing for increased costs to dispose of food waste in the regular waste stream.
Home composting/worm farming
If kerbside food waste collection is withdrawn an option to provide home composting or worm farming would cost up to an estimated $380,000 over 10 years, assuming a fully subsidised solution for every household who currently receives a kerbside service.
Council has not discussed the level of subsidy which may be provided, and it is unlikely every household would opt in, given the limited uptake of the kerbside service.
Have your say
Ohakune and Raetihi libraries, customer services, and offices - Consideration to have one location
Council is considering a shift over time to one library, customer service centre and Council office location in South Ruapehu instead of two. Any buildings that are no longer needed could then be repurposed or sold.
As this cannot happen overnight, Council is also considering reducing opening hours of libraries and customer service centres in the short-term, to help reduce costs while long-term options are progressed.
If there is appetite for change it will take time to develop proposals.
There are four possible scenarios being considered:
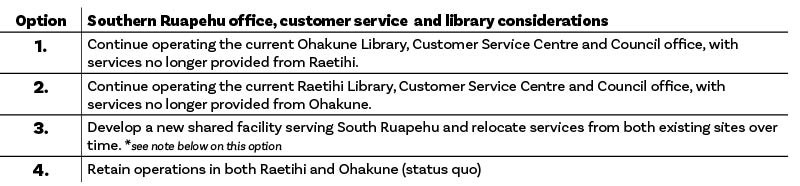
Note on Option 3
Council’s current Long-Term Plan includes working with Te Korowai o Wainuiārua to investigate and develop the Raetihi Community Hub, which could provide opportunities for a future shared community facility. Any future decision about libraries, customer services and Council offices could potentially align with wider community facility planning in South Ruapehu.
This project was included in the Long-Term Plan contingent upon external funding. The potential sale of current office and library assets may be able to help fund this option.
Note: To tell us what you think about this consideration click the banner at the bottom of this drop down.
What we currently deliver
Council currently operates library and office service centres in Taumarunui, Ohakune and Raetihi.
These centres combine libraries, Council customer services and staff offices. People can pay rates, ask questions, access Council services and receive support, while staff use the offices to deliver services across the district. The Raetihi office also houses NZ Post and NZTA services.
The libraries provide books, internet access, study spaces, community programmes, digital services, printing and information.
How does our level of service stack up?
Compared with similar rural and provincial councils, Ruapehu provides a relatively high level of service, with three customer service centres. This ranks us sixth equal among 29 small rural and provincial councils by number of customer service centres, with 15 providing only one customer service centre (including larger districts, such as Westland).
What makes Ruapehu unique is how close the southern facilities are to one another. At 11 kilometres apart, Raetihi and Ohakune are the closest two service centres in the peer group.
What you told us
In the July/August survey we asked a number of questions on library levels of service including having three libraries and on operating a library in both Ohakune and Raetihi given their proximity.
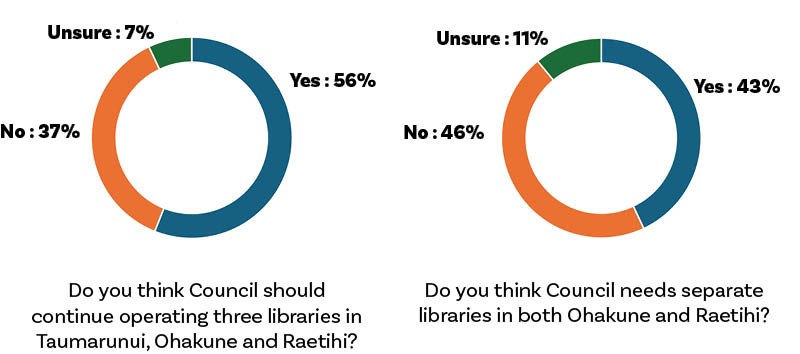
What you could save
Council currently spends approximately $500,000 per year operating library, customer service and office facilities in South Ruapehu. The amount that could be saved depends on how services are delivered in the future.

These figures are indicative only and assume services continue to be provided from a single location. They do not include any potential upgrade, relocation, asset sales or development costs.
Detailed work will need to be undertaken once a community preference is understood.
Tell us what you think
Ohakune-Raetihi walking/cycleway - Proposal to stop supporting development
What we are proposing
Council is considering whether it should continue supporting development of the proposed Ohakune-Raetihi cycle/walkway connection.
Council’s current Long Term Plan assumptions include a contribution of up to $190,000 towards delivery of the project, with the balance of funding expected to come from external sources (yet to be secured).
The current funding model assumes the completed pathway would be owned and maintained by a trust or another third-party organisation rather than Council. However, no ownership or maintenance arrangement has been confirmed.
Note: To tell us what you think about the proposal click the banner at the bottom of this drop down.
What we currently deliver
Council currently supports a network of walking and cycling facilities across the district. These facilities provide recreational opportunities, support health and wellbeing, encourage active transport, and contribute to the visitor economy.
Like all Council services and infrastructure, walking and cycling facilities have both upfront costs and ongoing responsibilities. Before supporting any new asset, Council must consider who will own it, who will maintain it, and who will carry the long-term financial responsibility for repairs and renewals.
What you told us
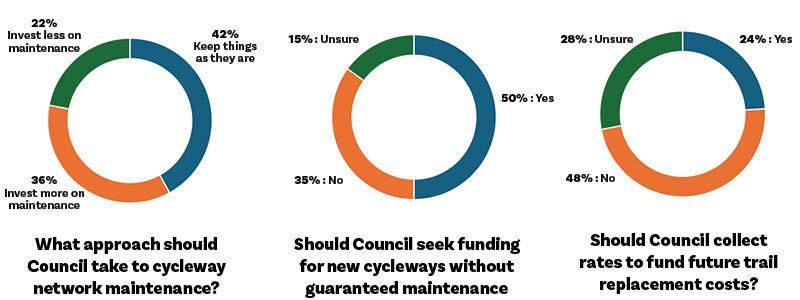
Previous engagement showed strong support for cycleways and trails across the district. At the same time, many respondents expressed concerns about the long-term cost of maintaining and replacing recreational assets.
If no trust or community organisation is willing to own and maintain the pathway, should Council and local ratepayers take on that responsibility?
Project considerations
There are a number of outstanding issues relating to ownership, maintenance responsibilities and liability for infrastructure with the route that currently remain unresolved. This includes the need to gain agreement around the use of a privately owned bridge.
Outstanding issues requiring resolution include:
- Route selection and landowner agreements
- Property access arrangements
- Bridge infrastructure and bridge ownership responsibilities
- Trail construction and surfacing
- Signage and wayfinding
- Vegetation management
- Health and safety obligations
- Insurance and liability arrangements
- Future maintenance and renewal responsibilities
Ratepayer contribution
Council’s funding assumptions for the project are based on:
- a one-off contribution of up to $190,000, ($95,000 FY2030/31 and $95,000 FY2031/32) and,
- securing external funding to cover construction costs, and
- a trust or third-party organisation owning and maintaining the completed pathway.
Council’s proposed $190,000 contribution to developing the project is indicative only.
If ownership and maintenance by a trust or other third party is not secured ratepayers could face costs arising from ownership, maintenance, bridges, trail renewals, vegetation management, inspections, signage, insurance, liability and any other operational requirements.
Further feasibility, design, costing and ownership work is needed before a final decision is made.
Community choices
Option 1: Continue supporting the pathway
Continue progressing planning and feasibility work, seeking external funding opportunities and ownership arrangements.
Option 2: Stop supporting the pathway
Withdraw Council funding support and avoid future ownership and funding uncertainty.
Have your say
Pools - Proposal to focus resources on fewer facilities
What we are proposing
Council is looking at whether it can continue providing swimming services through fewer facilities.
South Ruapehu:
Council is asking whether swimming services should continue to be provided through both the Ohakune and Raetihi pools, or whether one facility could provide swimming services for the area.
Taumarunui:
Council is asking whether it should continue supporting both the Taumarunui Pool and the Trust Waikato Community Pool, or focus on one facility.
These proposals are not about stopping people from being able to swim. It is about whether Council can keep providing swimming opportunities while reducing costs for ratepayers.
If Council decides it can no longer fund a pool, it will then consider other options, including whether community organisations could own or operate the facility in the future.
Note: To tell us what you think about the proposal click the banner at the bottom of this drop down
What we currently deliver
Swimming pools help people learn water safety skills, learn to swim, stay active and spend time with family and friends. Council currently owns and operates three public pools during summer:
- Ohakune Pool - a heated outdoor pool, a learner pool.
- Raetihi Pool - a covered pool, a learner pool, with solar heating and diving boards.
- Taumarunui Pool - an outdoor pool with six lanes, a learner pool, diving boards and community programmes.
Council also helps fund the Trust Waikato Community Pool at Taumarunui High School. This is the district’s only indoor, year-round public pool and the only pool that is fully accessible for people with disabilities. It provides swimming lessons, lane swimming, club activities, school use and community recreation.
How does our level of service stack up?
Ruapehu supports four public swimming facilities, giving us one of the largest pool networks of any small rural or provincial council in New Zealand. Only South Taranaki (8 pools) and Central Otago (6 pools) have more publicly accessible pool facilities.
What makes Ruapehu different is not just the number of pools, but how close some of them are to each other.
- The Taumarunui Pool and Trust Waikato Community Pool are only around 4-5 minutes apart.
- The Ohakune Pool and Raetihi Pool are only 11 minutes (11.5km) apart.
Many similar councils operate fewer pools that are much further apart. For example, the closest two pools in Mackenzie District are around 70 minutes apart, while in Buller District they are around 55 minutes apart.
What you told us
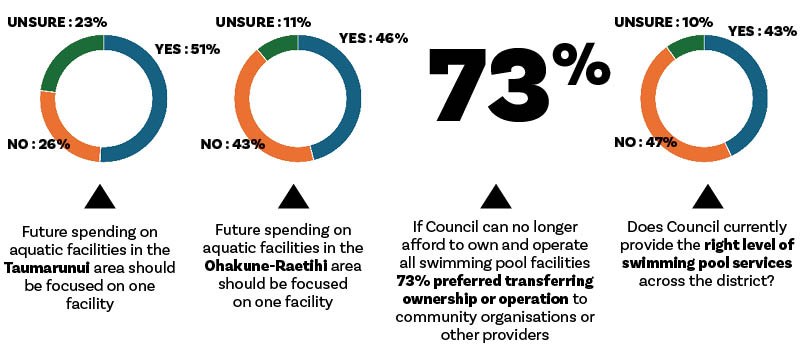
In the July/August survey we asked a number of questions on what you felt about your local pool services.
What you could save
The table below shows the estimated operating costs that could be avoided over ten years if Council no longer operated or funded a facility, along with some of the major upgrades currently identified.
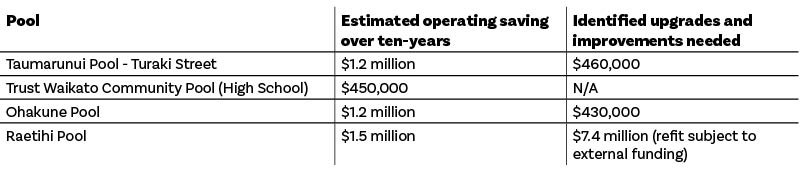
Without Council funding, the Trust may be unable to operate the Trust Waikato Community Pool, potentially returning it to the High School (Ministry of Education) and potentially impacting access to swimming programmes, clubs and holiday opening.
Have your say
Public toilets - Proposal to close toilets in Waimarino, Raetihi, and Tangiwai, and introduce user charging in Waiouru.
What we are proposing
Council is proposing to:
- Close the Carrol Street (Waimarino), Tangiwai and Ameku Road (Raetihi) public toilets.
- Introduce a user charge at the State Highway 1 public toilet in Waiouru (this would require investment for the charging system that Council maybe able to obtain external funding for).
These facilities have been identified following analysis of usage levels, operating costs and the availability of alternative facilities nearby.
Note:To tell us what you think about the proposal click the banner at the bottom of this drop down.
What we currently deliver
Council operates public toilets across the district for residents, visitors and people travelling through our communities. These facilities support public health, visitor experiences and accessibility, particularly in our town centres, parks and along key transport routes.
Public toilets require ongoing funding for cleaning, maintenance, repairs, water, wastewater and future renewals. Some facilities receive very high levels of use, while others are used relatively infrequently.
How does our level of service stack up?
Ruapehu provides public toilet facilities across a large geographic area, including several facilities that receive relatively low levels of use.
- Council provides three public toilets in Raetihi, with facilities on SH4 and Ameku Road open 24 hours / 7 days a week, and on Seddon Street (between 8am and 5pm daily).
- In Waimarino (National Park) there are facilities on Carroll Street as well as at the Park ‘n’ Ride on Findlay Street, both open 24 hours / 7 days a week.
- The award-winning Waiouru public toilet is one of the district’s busiest facilities due to its location on State Highway 1.
- The public toilets on SH48 in Tangiwai are not well-used and experience ongoing issues, including repeated theft of the installed solar power.
What you told us
Respondents were more supportive of closing rarely used public toilets than seasonal closures or wider cuts to save money. Views on user-pays toilets were mixed, with some supporting charges at tourist locations and others seeing toilets as a core public service. Concerns included public health, visitor experience and shifting costs to businesses.
What you could save
Public toilets require ongoing expenditure for cleaning, maintenance, consumables (toilet paper, soap, etc.), utilities and asset renewals.
Closing low-use and theft prone facilities, and introducing a user charge at Waiouru, would reduce the amount of funding required from ratepayers while helping recover some costs directly from users of one of the district’s busiest public toilet facilities.
- It is estimated that over 10 years, we could save $600,000 by closing the Carrol Street, Tanigwai and Ameku Road toilets.
- Estimated revenue for charging a fee at Waiouru is difficult to quantify. (There would be a cost to installing the charging mechanism however external funding maybe available for this)
- The total costs of operating the Waiouru toilets on SH1 over 10 years is approximately $1.35 million.
Have your say
Taumarunui/Manunui Halls - Proposal to close
What we are proposing
Council is considering the eventual closure and divestment of Taumarunui War Memorial Hall, Miriama Centre and Manunui Hall, provided suitable alternative facilities remain available to meet community needs.
This review now includes Manunui Hall. While earlier engagement focused on the Taumarunui War Memorial Hall and Miriama Centre, Council considers all three facilities part of the same network of community facilities serving the wider Taumarunui area.
Note: To tell us what you think about the proposal click the banner at the bottom of this drop down.
What we currently deliver
Council currently owns and operates three community halls in the Taumarunui area:
Taumarunui War Memorial Hall
The Taumarunui War Memorial Hall is a heritage facility and is capable of hosting events of around 150 people. The facility includes a stage, kitchen and multiple meeting spaces. In the previous year it had 69 bookings.
Miriama Centre
The Miriama Community Centre is Taumarunui’s largest facility with capacity for up to 275 people and extensive kitchen facilities. The facility is showing its age, has accessibility issues, and requires work to complete a property subdivision. In the previous year it had 66 bookings.
Manunui Hall
Manunui Hall supports a range of community activities and events, and is regularly use for community gatherings, classes and functions. In the previous year it had 104 bookings.
Community benefits, usage and funding
- The hall facilities provide indoor spaces for community events, meetings, classes, celebrations, and other activities. They can also be used during emergencies.
- Booking numbers indicate the number of recorded bookings during the period and do not reflect attendance levels, duration of use, or the broader community value of each facility.
- The majority of hall funding - to operate, maintain and renew these halls - is paid for by all ratepayers through general rates. Hire fees and user charges cover a smaller share of the costs.
Alternative venue options
These facilities form part of a broader network of community and event venues available to residents, alongside schools, marae, community organisations, churches, sporting groups private providers.
What you told us
Previous consultation found that community halls are valued by residents and community groups but that there is a range of views about the best way forward.
Feedback also highlighted affordability, value for money and interest in alternative ownership or management arrangements that maintain community access.
Known issues with halls
All three halls require upgrades and improvements within the next ten-years.
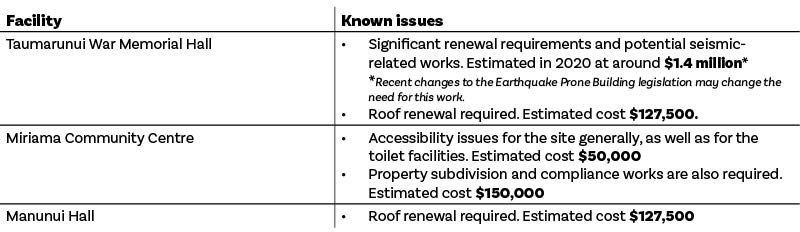
Transferring these halls would likely require investment in renewals, compliance, accessibility or other things. Council would only consider a transfer if suitable alternative facilities are available, and may support organisations providing them. No options have yet been developed or assessed.
What you could save
The three halls operate as a single activity, and operating costs cannot be reliably allocated between individual facilities. Estimated costs and revenue for the coming 2026/27 year are:
Operating revenue: $208,463
Revenue ($38,252)
Net cost to ratepayers $170,211 ($1.7 million over ten-years)
Over the next ten-years based on these estimated costs and identifed upgrades and improvements ratepayers could save approximately $2.2 million* from Council divesting itself of all three halls.
*Excludes potential earthquake strengthening cost estimates for the Taumarunui Memorial Hall.
Have your say on the proposal
Ongarue and Owhango Transfer Stations - Proposal to close
What we are proposing
After considering the feedback from the Community, the Council is proposing to close the Ongarue and Ōwhango transfer stations.
Note that due to contractual arrangements, these transfer stations may operate through until 2030.
Note:To tell us what you think about the proposal click the banner at the bottom of this drop down.
What we currently deliver
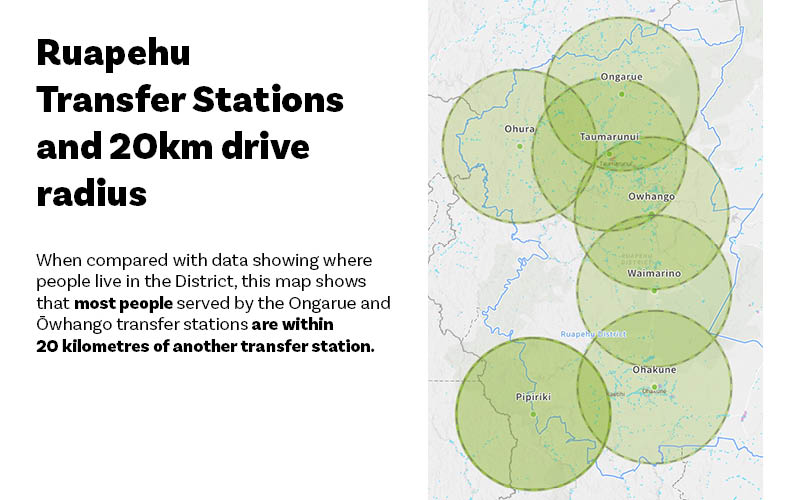
Council operates two main transfer stations and resource recovery centres in Taumarunui and Ohakune, as well as five small rural transfer stations in Pipiriki, Ōhura, Ongarue, Ōwhango, Waimarino (National Park).
As a part of considering advice the Council looked at the data showing the communities served by each transfer station, and what a “reasonable” distance to travel might be, settling on a figure of 20 kilometres.
How does our level of service stack up?
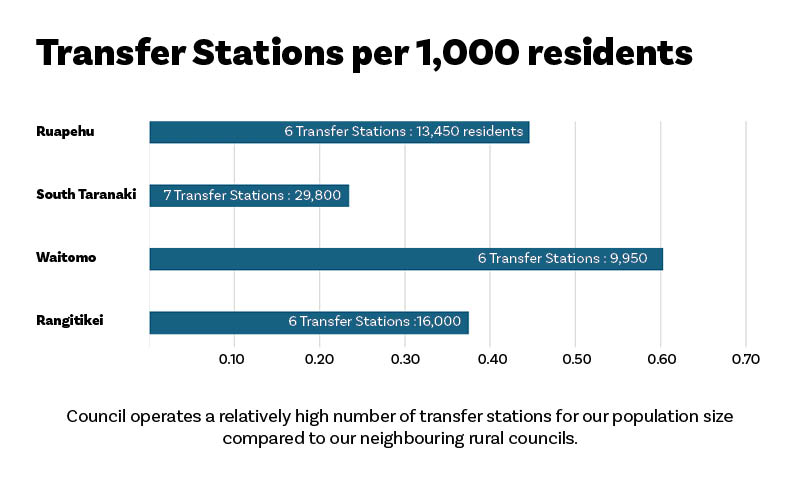
Council operates a relatively high number of transfer stations for our population size compared to our neighbouring rural councils.
What you told us
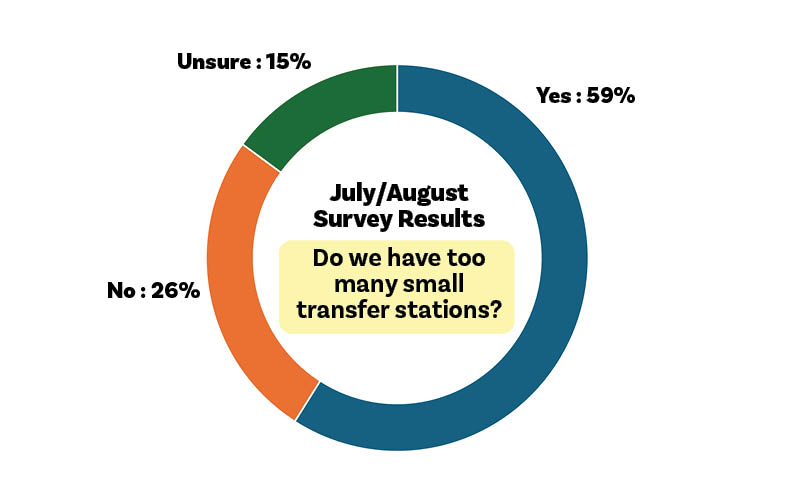
In the July/August survey we asked the community if they thought Council operated too many small, rural transfer stations with a majority (59%) of people thinking we did.
What could you save
The estimated savings for closing these sites over ten years is:
- Ongarue Transfer Station - $220,000 over 10 years, and
- Ōwhango Transfer Station - $500,000 over 10 years
Have your say
Areas we are seeking operational efficiencies
In addition to the service change proposals above Council has considered the community feedback and instructed staff to maintain services but seek operational efficiencies to reduce costs in the following areas:
- Communications
- Community & Business Development
- Economic Development
- Environmental Sustainability
- Policy & Strategy
- Waste Minimisation Programmes
- Youth Development
Other service level change proposals
There are also a number of areas notably roading where further work is required before potential options can be developed. Council will be coming back to the community with other levels of service proposals as part of the Long-Term Plan consultation next year.
Community hui and 'Coffee with a Councillor'
To provide an opportunity for people to find out more about the proposed service level changes, including drivers such as water rates, local government reform, rates capping, etc. and discuss other issues shaping the new ten-year 2027/37 Long-Term Plan we have organised a series of community hui and "coffee with a councillor" events.
| Event | Where | Time |
| Coffee with a Councillor - Ohakune | 17 Goldfinch Street, opposite New World | Sat 17 Oct, 9am to 12 noon |
| Community hui - Owhango | Owhango Hall, 2157 SH4, Owhango | Tue 20 Oct, 6pm to 9pm |
| Community hui - Ohura | Ohura Memorial Hall, Ngarimu St, Ohura | Wed 21 Oct, 6pm to 9pm |
| Community hui - Waimarino | The Park Hotel, 2/6 Millar St, Waimarino | Tue 27 Oct, 6pm to 9pm |
| Community hui - Raetihi | The Royal Theatre, 23 Seddon St, Raetihi | Wed 28 Oct, 6pm to 9pm |
| Coffee with a Councillor - Taumarunui | Kainui Coffee, Hakiaha St | Sat 31 Oct, 9am to 12 noon |
Pdf versions of the proposals
- Dog Fees.pdf
- Kerbside Food Waste Collection.pdf
- Offices, Libraries and Customer Services - Ohakune and Raetihi.pdf
- Ohakune-Raetihi Cycle and Walking Trail.pdf
- Ongarue and Owhango Transfer Stations.pdf
- Pools.pdf
- Pride of Place Grant Fund.pdf
- Public toilets.pdf
- Taumarunui and Manunui Halls.pdf
- Why we need to right-size services.pdf
July/Aug Services Review surveys - Results and Analysis
The following are the results from the July/August surveys that have informed this current round of consultation.
It includes for each activity area:
- An overview of the activity area.
- The key survey findings and analysis for the activity area.
- The original survey questions.
- The raw survey responses.
NOTE: Some responses have been redacted (in part) to remove bad language, hide the identity of the responder, or where the response has contravened Council's policy on engagement and feedback.
Community and Recreational Facilities
Community and Recreational Facilities provides services and facilities the community relies on and uses regularly which help make Ruapehu a great place to live, work and play. It includes our public pools, parks, reserves, sports fields, public toilets, litter bins, playgrounds, walkways, recreational cycle trails, cemeteries and community halls.
Like all Council services, these facilities cost money. Council must balance the level of service the community wants against what ratepayers can afford. Maintaining more facilities, or maintaining them to a higher standard, means higher rates. Reducing services saves money but changes what is available in our towns.
Key findings and analysis
Demographics
The survey received 520 responses the largest number of responders.
Responses were stronger from the south of the District, with:
- 40% from Raetihi
- 21% from Ohakune
- 23% from Taumarunui
- The remaining responses from smaller settlements across the District.
This means the response profile does not closely reflect the District's population. Raetihi and Ohakune each account for less than 10% of the District's population, while Taumarunui accounts for around 37% (or up to 47% when surrounding areas such as Manunui are included).
General feedback
Overall, the survey shows that the community is open to finding ways to reduce costs and improve how facilities are delivered, but is less supportive of reducing access to facilities seen as important community assets.
There was consistent support for:
- reviewing facilities that are underused
- matching maintenance levels to actual use
- finding alternative ways to own or manage facilities
- looking for efficiencies before considering closure or withdrawal of services.
There were also some clear differences between communities. Taumarunui respondents were generally more open to reducing or consolidating services, while Raetihi respondents were generally less supportive of changes.
Public Toilets (Q1-Q4)
Respondents were generally more accepting of rationalisation where facilities are underutilised than they were of broad service reductions.
The highest level of support was for closing public toilets that receive very little use, suggesting respondents are comfortable with evidence-based rationalisation where usage does not justify ongoing costs. Support was considerably weaker for seasonal closures and for closing facilities simply to reduce expenditure.
User-pays toilets generated mixed views. Some respondents saw tourism locations as suitable for charging, while others argued public toilets should remain a core public service. Open-ended comments frequently raised concerns around public health, visitor experience, and the risk of transferring costs to private businesses.
Key Insight
The public appears more supportive of removing genuinely low-use facilities than reducing service availability in locations where toilets are considered important for residents, visitors, or tourism.
Berms, Parks, Reserves and Sports Fields (Q5-Q8)
This question block produced some of the clearest support for efficiency measures across the survey.
Respondents generally supported:
- Reduced berm mowing outside high-profile areas.
- Reduced mowing in low-use parks and reserves.
- Maintaining sports fields according to utilisation levels.
- Reviewing underused reserves and sports grounds.
For underutilised reserves and sports fields, respondents showed greater preference for:
- Lower levels of service.
- Repurposing land for alternative community uses.
- Reviewing ongoing need.
There was less support for maintaining all facilities at existing service levels regardless of demand.
Geographic Difference
This was one of the few areas where a clear geographic split emerged.
- Taumarunui respondents showed significantly stronger support for maintenance reductions and usage-based service levels, with around 70% support across berms, parks and sports field questions.
- Raetihi respondents were much less supportive, with responses often evenly split between support and opposition.
Community Halls (Q9-Q12)
The hall questions suggest support for retaining community hall provision, but not necessarily retaining all current facilities.
The strongest themes were:
- Support for investing in at least one fit-for-purpose hall.
- Recognition that affordability is important.
- Support for balancing cost, functionality, and community identity.
A particularly strong finding was support for investigating alternative ownership, management, or operating models to reduce Council costs while maintaining community access. This was consistently supported across the District.
Geographic Difference
A clear result emerged regarding the future of halls in Taumarunui. Responses across the District indicate that there is support to have only one hall in Taumarunui.
Among Taumarunui respondents only:
- A majority indicated that Taumarunui only requires one community hall.
- Respondents were more likely to support investment in the War Memorial Hall than investment across both facilities.
Key Insight
There appears to be a community mandate to investigate alternative delivery models and potentially rationalise hall provision, particularly within Taumarunui.
Swimming Pools and Aquatic Facilities (Q13-Q17)
Swimming pools generated the strongest community response of any issue covered in the survey.
Respondents consistently identified pools as:
- Essential community infrastructure.
- Critical for child water safety.
- Important for recreation and wellbeing.
- Important for youth engagement and social outcomes.
There was broad support for continued investment in aquatic services, although respondents differed on how investment should occur. Preferred options generally included:
- Maintaining existing facilities.
- Upgrading heavily used facilities.
- Alternative ownership models where affordability becomes an issue.
When presented with affordability challenges, respondents overwhelmingly preferred transferring ownership or management to community organisations rather than reducing the number of pools.
Geographic Difference
Broadly, there is support across the District to look at options for rationalising the pools in Taumarunui (26% opposed). The most significant geographic split in the survey related to consolidation of pools in the Ohakune-Raetihi area.
Both:
- Ohakune respondents (65%), and
- Raetihi respondents (65%)
opposed focusing future aquatic investment into a single facility serving both communities.
This opposition was far stronger than elsewhere in the district and was reinforced throughout the written comments. Respondents frequently cited accessibility, transport barriers, water safety, and community identity as reasons for retaining local pool access.
Cycleways (Q18-Q20)
Cycleways were widely viewed as having value beyond recreation.
Respondents frequently linked cycleways to:
- Tourism.
- Economic development.
- Business activity.
- Diversification away from snow-based tourism.
While opinions varied on funding mechanisms, there was broad recognition of the strategic importance of maintaining the network.
Many respondents supported:
- Seeking external funding.
- Exploring user-pays contributions.
- Looking for alternative funding sources before increasing rates.
Question 20 (Should the Council collect rates to finance the future replacement of trails at the end of their lifespan, or depend on obtaining external funding when replacement becomes necessary?) received strongly negative feedback.
This indicates potentially an unwillingness to fund these, but with a high volume of unsure responses and negative feedback in the verbatim comments, potentially highlights a lack of understanding around how these are funded and what might happen if Council did not rate for their renewal.
Geographic Difference
Support for cycleway investment was significantly stronger in the southern communities.
Compared with Taumarunui, respondents from Ohakune and Raetihi were:
- More supportive of increased investment in the cycleway network.
- More supportive of pursuing future cycleway projects.
- More likely to view cycleways as important economic infrastructure.
This aligns closely with comments linking cycleways to visitor growth, local business activity, and long-term economic resilience in the southern part of the district.
Overall Conclusions
Most Supported Cost-Saving Measures
- Reduced mowing in lower-use areas.
- Usage-based maintenance standards.
- Reviewing underutilised facilities.
- Alternative ownership and operating models.
Most Sensitive Issues
- Consolidation of pools serving Ohakune and Raetihi.
- Reductions in access to swimming facilities.
- Broad toilet closures in visitor-serving locations.
Overall, the survey indicates residents are generally willing to support efficiency and optimisation initiatives, provided those changes do not materially reduce access to facilities that contribute strongly to community wellbeing, youth development, public safety, and economic resilience.
Survey Questions
Survey Responses
Communications
Good communication helps people understand what Council is doing, why decisions are being made, and how they can have their say. We do this through the Council website, social media, Antenno app, media releases, and community engagement. The function also supports elected members, the Mayor, and other Council teams by providing advice and communication materials.
Ruapehu has one dedicated communications employee. Many councils of a similar size have three or four communications staff often with dedicated roles for social media, websites, and graphic design.
Who benefits and how is it funded?
Residents, businesses, community groups, visitors, elected members, and Council staff all rely on accurate information to stay informed and make decisions. This activity is funded mainly through general rates because it benefits the whole community.
What level of service should Council provide?
Some communication activities are required by law, such as public notices, consultation, and emergency communications. Other activities go beyond the minimum requirements and are intended to improve how Council connects with the community. We wanted to know whether people thought these services are at the right level.
Key Findings and Analysis
Demographics
The survey received 385 responses.
- 31% from Taumarunui
- 23% from Raetihi
- 22% from Ohakune
- The remaining responses from smaller settlements and rural communities.
General Feedback
Overall, the survey indicates that respondents believe Council's current communications function is broadly appropriate, but there is room for improvement in how information is shared and how communities are engaged.
Respondents generally felt:
- Current levels of advertising and promotion are about right.
- Publications and consultation materials are broadly appropriate.
- Council keeps the community adequately informed.
- There are reasonable opportunities to participate in decision-making.
Geographic Differences
There were some minor differences between communities, although overall views were broadly consistent across the District. Raetihi respondents were somewhat less positive about Council’s communications, with 44% rating them poorly compared with 32% in Taumarunui and 25% in Ohakune. Similarly, Raetihi respondents were somewhat more likely to feel that additional opportunities to provide input were needed.
Key insights
The broader message remains consistent across the District: residents are generally comfortable with the current level of Council communication but would like information to be clearer, easier to find and supported by a wider range of communication channels.
The main opportunity is therefore to improve the consistency and accessibility of communications across the District, rather than significantly changing the overall approach.
Survey Questions
Survey Responses
Community and Business Development
This activity supports community groups, businesses, organisations and individuals by helping them access funding, connect with the right people, and get projects underway. Council administers several grants from other organisations, including Creative Communities and Sport NZ, and coordinates the Mayors Taskforce for Jobs programme.
Some of this work is required under funding agreements with Government and other organisations. Other services, such as business support, community planning and Council-funded grants, are discretionary and could be provided at a different level.
Who benefits and how is it funded?
This activity mainly benefits community groups, volunteers, businesses and young people seeking employment. Council’s contribution is funded through rates, while many of the grants and programmes it administers are funded by external organisations.
Key Findings and Analysis
Demographics
The survey received 337 responses.
- 31% from Taumarunui
- 25% from Ohakune
- 22% from Raetihi
- The remainder from smaller communities and rural settlements.
General Feedback
Overall, respondents were supportive of Council maintaining a role in community development, community funding support and assisting community groups to access external funding opportunities.
Support was strongest for:
- Helping community groups access funding and advice.
- Funding the Pride of Place Fund.
- Maintaining support for community halls.
- Continuing Council involvement in community and business development.
Support was weaker for:
- Some business development activities.
- The Mayor's Taskforce for Jobs programme.
- Dedicated funding for the Raetihi Information Centre.
- Dedicated funding for Citizens Advice Bureau services delivered from Te Kūiti.
A notable finding was the large proportion of respondents who were uncertain about current community and business development services, suggesting limited awareness of what is currently being delivered and how programmes operate.
Community and Business Development Services (Q1-Q7)
Respondents generally supported Council maintaining a role in community development and support services.
The strongest result in this section was support for Council helping community groups connect with funding and advice, with two-thirds of respondents supporting the activity.
However, respondents were less convinced that Council is currently delivering the right level of service. Only a small proportion believed the current level of service is appropriate, while almost half indicated they were unsure.
Comments frequently referenced:
- The value of supporting volunteers and community groups.
- The need for greater accountability and visibility of outcomes.
- Concerns about administrative costs.
- Limited understanding of what some programmes currently deliver
Geographic Difference
Clear differences emerged between Taumarunui and the southern communities.
- Taumarunui respondents were less supportive of Council having a role in community and business development, with support at 48%, compared with 67% in Ohakune and 74% in Raetihi.
- Taumarunui respondents were also less supportive of Council administering external grant programmes, with responses effectively split between support and opposition. By contrast, support exceeded 56% in both Ohakune and Raetihi.
- Support for helping community groups access funding and advice was high across the District but strongest in Ohakune (71%) and Raetihi (72%).
These results mirror those in other surveys.
Dedicated funding (rather than grants funding) (Q8)
The services the community most supported dedicated funding (rather than relying on grant funding) were:
- Community Halls (65%)
- Christmas Parades (55%)
- Trust Waikato Community Pool (52%)
Support was more divided for:
- Raetihi Information Centre (40% support, 40% opposition)
- Te Kūiti Citizens Advice Bureau services (39% support, 37% opposition)
Notably, only Raetihi supported funding for the Raetihi visitor information centre, while Ohakune and Taumarunui did not.
Key Insight
Respondents clearly favour funding assets and facilities with direct community benefit, particularly community halls and the community pool. Support becomes more location-specific when funding is directed toward facilities or services associated with a particular community.
Most Supported Services
- Helping community groups access funding, advice and support.
- Pride of Place funding.
- Community halls.
- Community and business development activities.
- Administration of external grant programmes.
Least Supported Services
- Dedicated funding for the Raetihi Information Centre (outside Raetihi).
- Te Kūiti Citizens Advice Bureau services.
- The Mayor's Taskforce for Jobs programme.
- Current business development service delivery arrangements.
Overall Conclusion
Overall, the survey indicates strong support for Council's role in strengthening communities, supporting volunteers, administering grants and helping groups secure external funding. Respondents were generally more supportive of community-focused activities than business-focused activities and showed a clear preference for funding services and facilities that provide visible and direct local benefit. Geographic differences were most apparent where funding was linked to facilities serving a specific community.
Survey Questions
Survey Responses
Economic Development
Economic development is about making the most of what Ruapehu has — our land, climate and people — to create opportunities and a stronger future. Council contracts Whanganui & Partners to deliver economic development services for Ruapehu through an agreement with Whanganui District Council.
This gives Ruapehu access to specialist skills, business networks, and programmes that would be difficult and more expensive to provide on our own. Tourism promotion is handled separately, by our Regional Tourism Organisation, Visit Ruapehu (covered in a separate set of questions).
Why is Council involved?
Although councils are expected to consider how their decisions affect the local economy, they are not required to fund economic development specifically — it remains a discretionary activity.
In a small rural district like ours, where the economy rests on tourism, agriculture and small business, contracting a specialist agency gives Council access to skills, knowledge and networks that would be difficult to build ourselves.
Who benefits, and how is it funded?
Local businesses benefit most directly, but the wider community gains too — through jobs, local services and a stronger local economy.
Economic development is paid for in two ways; by businesses who pay through their rates because they benefit most, and every property pays a small flat amount because the whole district benefits from a stronger economy.
Key Findings and Analysis
Demographics
The survey received 317 responses.
- 32% from Taumarunui
- 23% from Ohakune
- 22% from Raetihi
- The remaining responses from smaller settlements and rural communities.
General Feedback
Overall, the survey indicates mixed views regarding Council's involvement in economic development activities.
Respondents were generally divided on:
- Whether Council should continue funding economic development through contracted specialist expertise.
- The appropriate level of investment in economic development activities.
Many respondents indicated uncertainty about:
- The cost of current economic development activities.
- The outcomes being achieved.
- The value received from external providers and consultants.
Open-ended comments raised:
- Concerns about the use of external consultants.
- A desire for clearer reporting on outcomes and benefits.
- The importance of supporting local businesses and employment.
- Questions about whether economic development should be a Council responsibility.
Key Insight
The survey reveals a significant divide between Taumarunui and the southern communities regarding economic development activities. While Taumarunui respondents showed strong scepticism toward current delivery arrangements and future investment, respondents in Ohakune and Raetihi were generally more supportive of continued investment in economic development and recognised its role in supporting employment, business activity, and long-term district growth.
Overall, the survey indicates residents recognise the importance of economic development but are divided on how it should be delivered. Many respondents support economic growth initiatives in principle, but there is a strong expectation that investment be clearly linked to measurable local outcomes, employment opportunities, and economic benefits for Ruapehu communities.
Survey Questions
Survey Responses
Environmental Sustainability
Council’s work on climate change and environmental responsibility includes tracking emissions, developing climate strategy, and helping reduce our environmental impact and prepare for climate risks.
Why is Council involved?
Council needs to understand and respond to climate risks so that infrastructure, services, and communities stay resilient over the long term. This work also makes sure environmental considerations are factored into planning and decision-making. This will help council to make informed, evidence-based decisions and weigh up costs of any future actions against any potential risks.
Without this work, Council would be less prepared for future environmental challenges and may face higher costs over time. In many cases, the cost of doing nothing is likely to be greater than investing early to understand and manage risks.
Some of Council’s environmental sustainability work is required by law, to support planning, reporting, or existing bylaws. With climate change affecting our district more often and more severely, this activity also gives Council the strategic advice and evidence needed to plan and respond effectively.
However, some of this work is not required by law. Current work includes:
• Developing climate change and sustainability strategies and policies
• Measuring and reporting Council’s greenhouse gas emissions
• Providing environmental advice on Council projects, planning, and decisions
• Working with other councils on regional climate change planning
We asked what level of environmental sustainability work Council should provide.
Who benefits and how is it funded?
This activity is currently funded through a targeted rate across the district because the benefits are shared by all current and future ratepayers.
Key Findings and Analysis
Demographics
The survey received 351 responses.
- 29% from Taumarunui
- 23% from Ohakune
- 22% from Raetihi
- The remaining responses from smaller settlements and rural communities.
General Feedback
Overall, the survey produced mixed views regarding Council's environmental sustainability activities.
Support was strongest for:
- Establishing a disaster reserve or other mechanisms to spread the costs of emergency events.
- Regional collaboration on climate and resilience issues.
- Continuing to provide environmental advice for Council projects and decision-making.
- Practical planning activities linked to resilience and future risk management.
Support was weaker for:
- Climate change strategy and policy development.
- Measuring and reporting Council greenhouse gas emissions.
Open-ended comments reflected strongly differing opinions on climate change and environmental sustainability. Some respondents viewed this work as essential long-term planning and risk management, while others saw it as a lower priority than core Council services and infrastructure.
There were also some clear differences between communities. Southern respondents were generally more supportive of environmental sustainability activities, while Taumarunui respondents were generally less supportive. This reflects overall trends within the surveys.
Responses suggest residents differentiate between climate-related planning activities and practical resilience measures.
The strongest support across the survey was for investigating a disaster reserve fund to spread recovery costs following natural disasters. This received strong support across almost all communities regardless of respondents' views on climate policy.
Written comments frequently highlighted concerns regarding affordability, duplication with regional or central government functions, and the need to prioritise practical actions over administrative processes. At the same time, many respondents viewed environmental sustainability as important to tourism, community resilience, infrastructure planning, and long-term economic wellbeing.
Geographic Difference
A clear geographic split emerged between Taumarunui and the southern communities across several questions.
- Taumarunui respondents were considerably less supportive of climate change strategy and policy development, with responses almost evenly divided between support (44%) and opposition (47%).
- Ohakune (59%) and Raetihi (63%) respondents were more supportive of continuing climate change and sustainability strategies, with substantially lower opposition levels than Taumarunui.
- The greatest geographic difference emerged around regional climate collaboration. Raetihi respondents showed particularly strong support (74%) for Council continuing to work with other councils on climate planning and initiatives. Support was also high in Ohakune (64%), compared with 45% in Taumarunui.
- Carbon emissions reporting received significantly stronger support in Raetihi (53%) than in Taumarunui (33%) or Ohakune (33%), making this one of the clearest geographic differences in the survey.
Key Insight
Regardless of views on climate policy, there was broad support across the District for practical resilience measures, particularly establishing mechanisms to manage the financial impacts of future natural disasters.
Most Supported Measures
- Investigating a disaster reserve fund.
- Regional collaboration on resilience and planning.
- Environmental advice to support projects and decision-making.
Most Sensitive Issues
- Climate change strategy and policy development.
- Greenhouse gas emissions reporting and monitoring.
- Perceived duplication of work undertaken by regional or central government.
Overall, the survey indicates residents are more supportive of practical environmental resilience initiatives than administrative or reporting activities. Support for climate-related work is strongest in Ohakune and Raetihi, while respondents in Taumarunui are generally more cautious about continued investment in these areas.
Survey Questions
Survey Responses
Libraries
Council runs three libraries – in Taumarunui, Ohakune and Raetihi and supports Waiouru’s community library. Council libraries share a building with our local administration and customer services. Ohakune and Raetihi are approximately a ten-minute drive apart.
Our libraries provide free access to books, magazines, puzzles and games, digital resources, computers, Wi-Fi, printing and other information services. They offer a safe, welcoming place where people can read, study, learn new skills, access online services, attend community programmes or simply spend time.
Library staff also provide wider services for the community, including running programmes with local education centres and community groups, and offer home delivery services.
Who benefits and how is it funded?
Libraries help support reading, lifelong learning, digital access and community connection. They are used by people of all ages, from preschool children through to older residents.
The library service is funded mainly through rates. While we don’t currently charge fees to borrow books and resources, we do currently charge for printing, lost books and loaning books from other libraries.
Why are we reviewing library services?
How people use libraries is changing. While many people still value borrowing books, more people are using digital services, online resources, free internet access and community spaces. Like all Council services, libraries are being reviewed to make sure they stay affordable while continuing to meet community needs.
Key Findings and Analysis
The survey received 397 responses.
- 29% from Taumarunui
- 24% from Ohakune
- 23% from Raetihi
- The remaining responses from smaller settlements and rural areas.
General Feedback
Overall, the survey shows that the community values library services and generally supports retaining library access across the District.
Respondents were most supportive of:
- Self-service technology to reduce operating costs while maintaining services.
- User-pays options for premium services such as new-release books.
- Exploring operational efficiencies before reducing access.
- Retaining physical library services alongside digital offerings.
Geographic Difference
The most significant geographic difference related to the future of library services in the Ohakune-Raetihi area.
- Taumarunui respondents were significantly more supportive of consolidation, with only 18% supporting separate libraries in both Ohakune and Raetihi, while 67% opposed maintaining two facilities.
- Ohakune respondents were more supportive of retaining local provision, with 55% supporting separate libraries in both communities.
- Raetihi respondents showed the strongest support for retaining separate libraries, with 71% supporting continued provision in both communities.
Key Insight
There appears to be broad support for pursuing efficiencies within library services, provided access is maintained. The District is divided on the need for two libraries in the south.
Respondents from both Raetihi and Ohakune support retaining separate libraries in both townships. Taumarunui does not support two libraries in the south.
Overall Conclusions
Overall, the survey indicates that residents are generally willing to support operational efficiencies and alternative service delivery approaches. There is a clear north-south divide on the need for separate library services in Raetihi and Ohakune, which may prompt further discussion on what level of service is appropriate and how it might be funded.
Most Supported Cost-Saving Measures
- Increased self-service technology.
- User-pays fees for premium services such as new-release books.
- Reduced opening hours.
- Moderate reductions in book purchasing budgets.
Survey Questions
Survey Responses
Policy and Strategy
Policy and Strategy helps Council plan for the future and make informed decisions. It includes preparing Council key strategic planning documents such as the Long-Term Plan and Annual Plan, developing strategies, policies and bylaws, reviewing Council’s non-financial performance and providing advice to elected members.
Why does Council do this?
Council needs to plan ahead, set priorities, and make decisions that balance community needs with what ratepayers can afford. Good planning helps ensure services work well together, resources are used wisely, and Council is prepared for future challenges and opportunities.
Who benefits, and how is it funded?
Everyone in the district benefits from good planning and clear direction. It helps ensure Council delivers the right services in the right way. This activity is funded mainly through general rates.
Could we reduce services to reduce costs?
Some of this work is required by law. Other work helps inform Council to make better decisions or to make sure our District’s voice is heard by others.
We could reduce or stop some Policy and Strategy activities to save money, although this may mean Council has less say on issues affecting the district or fewer local policies to guide decision-making.
Key Findings and Analysis
Demographics
The survey received 278 responses.
- 30% from Taumarunui
- 25% from Raetihi
- 22% from Ohakune
- The remaining responses from smaller settlements and rural communities.
General Feedback
The strongest result in the survey was support for reducing advocacy activity and limiting Council involvement to:
- Statutory requirements.
- Matters with significant impacts on the District.
- Core Council functions.
Geographic Difference
As with other surveys, there was a general theme of Taumarunui, which is the largest and poorest major population centre, favouring options that would reduce Council’s spend.
- Taumarunui respondents were less supportive of maintaining non-statutory policy work, with responses effectively split between support (45%) and opposition (48%).
- Raetihi respondents were more supportive of continuing local policy development, with 58% supporting Council maintaining policies where a community benefit exists and only 28% opposed.
- The strongest geographic difference emerged on Council advocacy activities. Taumarunui respondents showed strong support for reducing advocacy work, with 66% supporting limiting activity to legally required or significant matters.
- Raetihi respondents were notably less supportive of reducing advocacy activity, with support falling to 48% and a significantly larger proportion remaining unsure.
Key Insight
The survey indicates a community preference for a more focused policy and strategy function, particularly around advocacy activities.
Survey Questions
Survey Responses
Roading
Council maintains and develops the local transport network so people and goods can move freely and safely around the district. Our local road network covers more than 1,300km with around two-thirds unsealed. The network includes 357 bridges with 99 large culverts, 5.6 km of retaining walls, 70.5 km of footpaths and 1,545 streetlights. State highways are managed separately by Waka Kotahi - NZ Transport Agency.
Why is this important?
Roading is Council’s largest area of spending and with the loss of water is arguably our most valued and visible service. It supports community connectivity, safety, and economic activity, but must remain affordable for ratepayers.
What are the challenges?
Ruapehu has a large transport network, challenging terrain, harsh weather conditions and a small, spread out population. This makes roads, bridges and other transport assets expensive to maintain. While Council currently receives significant Government funding, future funding levels are uncertain. At the same time, costs for maintaining and replacing transport assets continue to increase.
Key Findings and Analysis
The survey received 371 responses with the consultation demonstrating broad community support for a targeted and pragmatic approach to roading investment.
Respondents generally support directing investment towards roads that deliver the greatest community benefit, while also wanting to maintain reliable access across the district. Support is strongest where proposals are linked to clear public-benefit outcomes, occupancy levels, or user-pays principles.
Importantly, responses vary between communities, reflecting different local circumstances and network dependencies. Smaller rural settlements were often more supportive of prioritisation measures, while larger population centres tended to show more balanced views, particularly regarding service reductions and user-pays proposals
Demographics
The consultation was dominated by responses from the district's three largest centres:
| Taumarunui | 114 |
| Ohakune | 78 |
| Raetihi | 72 |
| Owhango | 17 |
| Ohura | 9 |
| Waimarino | 9 |
| Rangataua | 9 |
| Ongarue | 6 |
| Waiouru | 6 |
Together, Taumarunui, Ohakune and Raetihi accounted for approximately 74% of all location-based responses.
Road Prioritisation and Funding (Q1-Q2)
Respondents generally supported directing investment toward the most important roads in the network.
A majority supported prioritising Class 1 roads over lower-use roads, suggesting an acceptance that scarce funding should be directed where it delivers the greatest benefit.
However, support for giving rural Class 1 roads a greater share of funding than urban Class 1 roads was much more divided. Responses indicate that while residents support prioritisation, they are less convinced that one Class 1 category should clearly take precedence over another.
Open-ended comments often highlighted the importance of balancing:
- Freight and economic value.
- Community access.
- Safety.
- Tourism and visitor routes.
Geographic Difference
No strong statistically meaningful geographic split emerged among the major centres. While smaller rural communities tended to favour greater emphasis on rural roads, the larger communities generally showed mixed views rather than clear divergence.
Key Insight - Prioritisation and Funding
The community broadly accepts the principle of prioritisation, but there is less agreement on exactly which roads should receive preferential funding.
Low-Volume Roads and Paper Roads (Q3-Q5)
Respondents were divided on whether Council should reduce service levels on low-volume roads, with slightly more opposition than support overall. Many comments argued that reducing maintenance ultimately increases long-term costs and risks safety outcomes.
Proposals to stop maintaining roads that serve only one property received stronger support than general service reductions. Support appeared largely driven by perceptions of fairness and efficient use of public funds rather than a desire to reduce the network.
Support increased substantially when respondents were asked about:
- Unoccupied properties.
- Roads with limited public benefit.
This suggests respondents distinguish between essential access infrastructure and roads providing little wider value.
Geographic Difference
Urban respondents generally showed greater support for:
- Reducing service on very low-use roads.
- Converting single-property roads to paper roads.
- Reviewing roads with limited public benefit.
Rural respondents were less supportive on the whole.
Key Insight - Low Volume and Paper Roads
Residents are more willing to support targeted withdrawal of service where public benefit is low than broad reductions to the low-volume road network.
Bridges and Property Access (Q6-Q7)
Bridges generated stronger opposition to service withdrawal than roads.
However, similar to Q5, support increased significantly when respondents were asked about bridges serving:
- Unoccupied properties.
- Areas with limited public benefit.
Many comments suggested shared funding arrangements rather than a complete transfer of responsibility.
Geographic Difference
- Between townships
No clear geographic split was evident among major communities. The strongest variation was between rural and urban respondents generally, rather than between individual townships.
- Urban/Rural
Urban respondents were somewhat more comfortable with transferring responsibility for low-benefit bridges, while rural respondents were more likely to oppose the proposal altogether.
Summary
Bridges generated less support for service withdrawal than roads.
Support increased considerably when bridges served:
- Unoccupied land.
- Very limited public benefit.
Key Insight - Bridges
Residents are more protective of bridge infrastructure than roads, particularly where bridges provide essential rural access. The community appears reluctant to abandon bridge infrastructure altogether, but is open to reviewing assets that provide very limited public value.
Resident-Funded Sealing Projects (Q8)
Respondents provided moderate support for removing lower-priority sealing projects from Council's programme unless residents funded a local contribution.
Geographic Difference
No statistically meaningful split emerged among major communities. Support and opposition were relatively balanced across the district, with Raetihi less sure overall (more unsure responses) and Ohura less supportive overall (more negative responses)
Key Insight - Local Contributions
Residents appear open to greater local contributions, but not to a fully private or user-funded model for road upgrades.
Survey Questions
Survey Responses
Survey Responses by Township
Rubbish and Recycling
While councils must provide waste minimisation services they can choose how those services are delivered. Our services include:
- Kerbside rubbish collection
- Kerbside recycling collection
- Kerbside food scraps collection
- Transfer Stations
- Resource Recovery Centres
- Managing and monitoring closed landfills
Why is reducing waste to landfill important?
Since the Taumarunui landfill closed, all rubbish has to be taken to a Transfer Station near Auckland. Council also pays the Government a $75-per-tonne waste levy. This makes landfill disposal much more expensive. To help reduce these costs, Council has invested in food scraps collection, composting and Resource Recovery Centres. These services help keep reusable and compostable material out of landfill. These initiatives are making a difference. Ruapehu sends less waste to landfill and recycles more than the national average.
Who benefits and how is it funded?
Everyone benefits when we reduce the amount of waste sent to landfill. Recycling and disposing of waste safely also protects public health and the environment that our economy depends on. Households in areas that receive kerbside rubbish, recycling and food scraps collections pay for those services through targeted rates.
Other services are funded by a mix of user charges, including the sale of official rubbish bags and fees paid at transfer stations, and the general rate. The Government also supports this activity by returning a portion of the “waste levy” to Councils.
Key Findings and Analysis
Demographics
The survey received 443 responses the second largest number of responses (after Community and Recreational Facilities)
Responses were concentrated in:
- Taumarunui (31%)
- Raetihi (26%)
- Ohakune (22%)
- Remaining responses from smaller communities and rural settlements.
General Feedback
Overall, respondents were supportive of retaining most current rubbish and recycling services and generally opposed reductions in waste and recycling infrastructure.
The strongest support was for:
- Retaining public rubbish and recycling bins.
- Retaining transfer stations.
- Retaining the Raetihi recycling bins.
- Continuing waste minimisation and recycling programmes.
The most divided issue was the kerbside food scraps collection service, where the community was effectively split on whether it should continue.
Written comments frequently referred to:
- Concerns that reducing services would increase illegal dumping and littering.
- Strong support for retaining local recycling facilities.
- Requests for more education around recycling and waste minimisation.
- Calls for wheelie bins rather than pink rubbish bags.
- Requests for soft plastics recycling.
Food Scraps Collection and Alternatives (Q1-Q2)
The food scraps service generated the most divided responses in the survey.
When asked whether Council should stop the kerbside food scraps collection service:
- 45% supported stopping the service.
- 45% opposed stopping the service.
- 10% were unsure.
While the service itself divided opinion, a majority supported Council helping residents adopt alternatives such as home composting and worm farming if the service were discontinued.
- 56% supported Council assisting with alternatives.
- 34% opposed.
- 10% were unsure.
Comments reflected two distinct perspectives:
- Some respondents considered food scraps collection costly and underutilised.
- Others viewed it as an important waste reduction initiative that should be retained or expanded.
Geographic Difference
A noticeable geographic split emerged.
- Taumarunui respondents were more likely to support stopping the food scraps collection service, with 51% supporting removal and 42% opposing it.
- Ohakune respondents were more likely to support retaining the service, with 51% opposing removal and 38% supporting removal.
- Raetihi respondents also leaned toward retaining the service, with more respondents opposing removal (45%) than supporting it (41%).
Waste Minimisation Programmes (Q3)
Respondents were generally opposed to reducing or stopping waste minimisation and recycling programmes.
- 56% opposed reductions.
- 30% supported reductions.
- 14% were unsure.
Comments frequently supported continued education, recycling initiatives and waste diversion programmes, while some respondents questioned programme costs and effectiveness.
Geographic Difference
Support for retaining programmes was relatively consistent across the District.
- Raetihi respondents showed the strongest opposition to reducing programmes, with 59% wanting services retained.
- Taumarunui respondents were more divided, although a majority still opposed reductions.
Key Insight
There is a clear preference for maintaining waste minimisation activities, although respondents expect visible outcomes and ongoing community education to justify continued investment.
Transfer Stations (Q4)
Respondents generally did not believe there are too many small transfer stations.
- 59% opposed reducing transfer stations.
- 26% believed there are too many.
- 15% were unsure.
Comments frequently highlighted:
- Travel distance.
- Fuel costs.
- Rural accessibility.
- Concerns about illegal dumping if facilities are removed.
Geographic Difference
The strongest support for retaining transfer stations came from smaller and rural communities.
- Raetihi respondents strongly opposed reducing transfer stations, with nearly 70% indicating there are not too many.
- Similar views were evident in Owhango, Ohura and Waimarino.
Key Insight
Respondents generally view transfer stations as essential local infrastructure rather than discretionary services, particularly in rural communities where alternatives require significant travel.
Raetihi Recycling Bins (Q5)
Respondents generally opposed removing the Raetihi recycling bins.
- 56% opposed removal.
- 31% supported removal.
- 13% were unsure.
Comments frequently referenced:
- Heavy usage.
- Importance for surrounding rural communities.
- Concerns that removal would increase dumping and reduce recycling activity.
Geographic Difference
This question generated the strongest geographic difference in the survey.
- Raetihi respondents overwhelmingly opposed removal, with 83% wanting the bins retained.
- Taumarunui respondents were split, with slightly more supporting removal than retention.
Key Insight
The Raetihi recycling bins are viewed locally as a highly valued service. While respondents elsewhere were more divided, Raetihi residents expressed a strong preference to retain existing service levels.
Public Rubbish and Recycling Bins (Q6)
Respondents generally opposed reducing the number of public rubbish and recycling bins.
- 55% opposed reductions.
- 36% supported reductions.
- 9% were unsure.
Comments consistently linked public bins with:
- Cleaner public spaces.
- Reduced littering.
- Reduced illegal dumping.
- Better visitor experiences.
Geographic Difference
- Raetihi respondents strongly opposed reducing public bins, with 74% wanting current bin provision retained.
- Ohakune respondents also opposed reductions, with 56% wanting bins retained.
- Taumarunui respondents were more divided, with support for reductions nearly matching opposition.
Key Insight
Respondents generally see public bins as contributing directly to community cleanliness and reducing litter. There is little appetite for significant reductions in current provision levels. [
Overall Conclusion
The survey shows broad community support for maintaining existing rubbish and recycling infrastructure across the District. While respondents were divided on the future of the kerbside food scraps collection service, there was comparatively strong opposition to reducing transfer stations, public bins, recycling facilities and waste minimisation programmes. Concerns about illegal dumping, litter and reduced access to services were recurring themes throughout the feedback, particularly in smaller and rural communities.
Survey Questions
Survey Responses
Tourism and Visitor Services
Tourism is one of Ruapehu’s biggest industries. It helps create jobs, supports local businesses, and attracts investment into our district. Tourism contributes about 8% of Ruapehu’s economy, making it an important part of our future.
Council supports tourism in two ways via:
• Visit Ruapehu, our regional tourism organisation, and the
• i-SITE network, which provides visitor information and services in Ohakune, Taumarunui, and via a mobile unit.
Together Visit Ruapehu and the i-SITEs help attract more visitors, encourage them to stay longer, and support local businesses and communities.
Why is Council involved?
Council invests in Visit Ruapehu and the i-SITE network because tourism benefits the wider district economy. More visitors mean more spending, more jobs, more business investment and stronger local communities. Visit Ruapehu markets Ruapehu throughout New Zealand and overseas, works with tourism operators to improve visitor experiences, and helps attract new tourism investment.
i-SITEs provide visitor information, make bookings, promote local businesses, help visitors travel safely, and support residents with local information and transport bookings. They also provide some additional visitor facilities such as public showers.
Who benefits and how is it funded?
Visit Ruapehu is funded through the Economic Development targeted rate, reflecting the tourism benefits received by commercial, industrial, and visitor accommodation properties. i-Site services are funded through the general rate.
Key Findings and Analysis
Demographics
The survey received 345 responses.
- 31% from Taumarunui
- 24% from Ohakune
- 23% from Raetihi
- The remaining responses from smaller settlements and rural communities.
General Feedback
Overall, the survey shows strong support for tourism as an important contributor to the District's economy.
Respondents generally supported:
- Tourism promotion.
- Continuing destination marketing.
- Supporting tourism businesses and visitor experiences.
- Maintaining regional and national tourism partnerships.
However, support was weaker for:
- Visitor service infrastructure where utilisation was perceived to be low.
- Council-funded visitor services that were viewed as benefiting visitors more than residents.
- Continuing some i-SITE-related functions without clearer evidence of value.
Open-ended comments frequently referenced:
- The importance of tourism to local businesses and employment.
- Concerns regarding value for money and accountability.
- The importance of retaining key visitor services in Taumarunui.
- Interest in alternative delivery models and user-pays approaches.
There were also clear differences between communities. Southern respondents were generally more supportive of tourism investment and promotion activities, while Taumarunui respondents were more supportive of retaining visitor services located in Taumarunui.
Tourism and Destination Management (Q1-Q4)
This question block showed strong support for tourism and destination management activities.
Respondents overwhelmingly supported:
- Tourism promotion for the District.
- Supporting local tourism businesses.
- Developing new visitor experiences.
- Destination marketing.
- Regional and national tourism partnerships.
Written comments frequently referenced:
- Tourism as an important economic driver.
- The role of tourism in supporting local businesses.
- The importance of attracting visitors as traditional industries decline.
- The need to ensure tourism investment delivers measurable outcomes.
Geographic Difference
Support for tourism activities was strong across the District, with somewhat higher support in Ohakune and Raetihi. Southern communities were more supportive of Council continuing to support tourism businesses, develop visitor experiences, undertake destination marketing, and have Visit Ruapehu lead regional and national tourism partnerships. Taumarunui respondents were still generally supportive, but at slightly lower levels.
Key Insight
Tourism promotion and destination marketing enjoy strong support across the District, but support is strongest in Ohakune and Raetihi. Southern respondents appear more likely to view tourism investment as important economic infrastructure and are more supportive of ongoing investment in tourism promotion and destination development.
Taumarunui i-SITE and Visitor Services (Q5-Q8)
Responses to visitor service questions were considerably more mixed than responses to tourism promotion activities.
The strongest support was for:
- Retaining bus booking services in Taumarunui.
Support was weaker for:
- Continuing visitor information services in their current form.
- Retaining the mobile i-SITE.
- Public shower facilities in Taumarunui.
Open-ended comments frequently referenced:
- The importance of visitor information services for older residents and visitors.
- The role of the i-SITE in supporting transport services.
- Interest in alternative delivery models, co-location, and user-pays approaches.
- Questions around utilisation and value for money.
Geographic Difference
The strongest geographic difference in the survey related to the future of visitor services in Taumarunui.
- Taumarunui respondents were significantly more supportive of retaining visitor information services, with 55% supporting continued provision and 35% opposed.
- Ohakune respondents were substantially less supportive, with only 19% supporting retention and 52% opposed.
- Taumarunui respondents also showed stronger support for retaining bus booking services, with 71% support compared with 53% in Ohakune.
Written comments suggest Taumarunui respondents often viewed these services as important community infrastructure rather than purely tourism services. Respondents frequently mentioned public transport access, visitor assistance, train and bus bookings, and support for residents without access to online services.
A further difference emerged regarding the mobile i-SITE.
- Taumarunui respondents were the least supportive of retaining the mobile i-SITE, with 47% opposed and only 26% supportive.
- Responses elsewhere in the District were generally mixed, with a high proportion of unsure responses suggesting relatively low awareness of the service.
Most Supported Services
- Tourism promotion.
- Destination marketing.
- Support for tourism businesses and visitor experiences.
- Regional and national tourism partnerships.
- Retention of bus booking services in Taumarunui.
Least Supported Services
- Public shower facilities in Taumarunui.
- Retention of the mobile i-SITE.
- Continued operation of visitor information services in their current form where usage is low.
- Tourism infrastructure and services that are perceived as providing limited benefit to residents or lacking clear evidence of use.
Overall Conclusion
Overall, the survey indicates strong support for tourism as a driver of economic growth, visitor spending, and business activity across the District. Support is strongest in the southern communities, where respondents were consistently more supportive of investment in tourism promotion, destination marketing, and visitor experience development. However, respondents were more cautious about retaining lower-use visitor services and showed a preference for reviewing service delivery models where costs may outweigh demonstrated community or visitor benefits.
Survey Questions
Survey Responses
Youth Development
Youth Development helps young people (rangatahi) get involved in their communities, develop leadership skills, and have a say in local decisions. While not a required Council service, it is supported because of the positive benefits it creates for young people and the wider community.
A key part of this work is Te Pae o Rangatahi – Ruapehu Youth Council, which gives young people from across the district the opportunity to represent the views of other rangatahi and provide advice to Council. Council also supports youth engagement, leadership opportunities, and projects led by young people.
Why is Council involved?
Young people are the future of our district. Supporting them to participate in local decision-making helps develop future leaders, builds stronger communities, and ensures Council hears the views of younger generations. Council provides the support, coordination, and resources needed to help young people participate safely and effectively.
Who benefits, and how is it funded?
Young people benefit by gaining leadership experience, confidence, and opportunities to contribute to their community. The wider community benefits from stronger future leaders and better-informed Council decisions that reflect the views of all generations. Because these benefits are shared across the district, Youth Development is funded through general rates.
Why are we reviewing Youth Development?
Council is not required to do youth development. Council is reviewing this activity to determine whether it should continue to be funded by ratepayers and, if so, at what level.
Key Findings and Analysis
The survey received 311 responses.
- 30% from Raetihi
- 28% from Taumarunui
- 21% from Ohakune
- The remainder from smaller communities and rural settlements.
General Feedback
Overall, respondents were generally supportive of Council having a role in youth development and providing opportunities for young people to participate in community life and decision-making.
Support was strongest for:
- Council having a role in youth development (62%).
- Providing opportunities for young people to participate in Council decision-making (64%).
- Investing in leadership and skill-building opportunities (60%).
- Supporting youth-led initiatives (63%).
Support for a Youth Council was lower but still received majority support overall, with 52% in favour and 36% opposed.
Written comments revealed a clear divide between respondents who viewed youth development as an investment in the District's future and those who believed youth development should primarily be delivered by families, schools, community organisations or central government agencies.
Summary
The survey produced generally positive results across all youth development questions.
District-wide majorities supported:
- Council having a role in youth development (62%).
- Providing opportunities for young people to participate in Council decision-making (64%).
- Investing in leadership and skill-building opportunities (60%).
- Supporting youth-led initiatives (63%).
Support for a Youth Council was lower but still received majority support overall, with 52% in favour and 36% opposed.
Geographic Difference
The most notable geographic pattern was the stronger support from southern communities, particularly Raetihi. This follows similar trends in other surveys.
Raetihi respondents consistently showed the strongest support for youth development activities, with support levels ranging from 71% to 75% across most questions.
Taumarunui respondents were noticeably less supportive, with support levels generally around 46% to 51% across most questions.
Survey Questions
Survey Responses
Timeline and key stages to Long-Term Plan 2027/37
Phase one: July-August 2026
Over July/August we asked people what they think about Council services to help us understand which services matter most, and where changes could be made, to help keep rates affordable and aligned with local government reform.
Phase two: October-November 2026
Council has used your feedback to the July/August surveys to develop proposed service level changes. We are now asking the community for their views on these which are aimed at lowering the rates requirement.
Phase three: March-April 2027
Council will prepare a draft Long-Term Plan for formal consultation. The community will then be able to review the options, make submissions, and help shape the final decisions.


